The Otsuka Group at a Glance
-

- Number of
employees - 37,758
-
- Japan
14,024 - Outside Japan
23,734
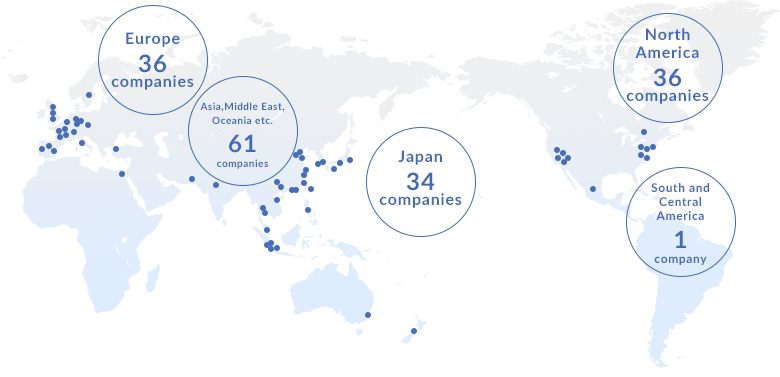
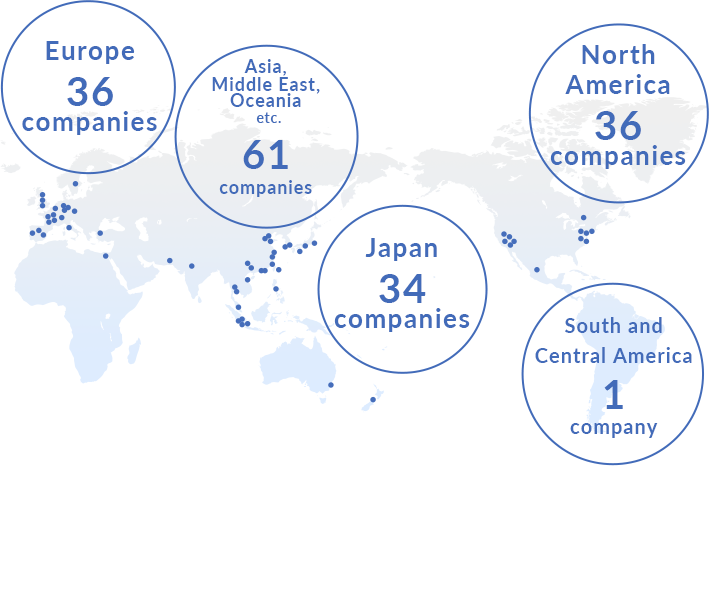
- Japan
- Number of
-

- Total group
companies - 182
-
- Japan
37 - Outside Japan
145
- Japan
- Total group
-

- R&D sites
- 37 sites
-
- Japan
18 sites - Outside Japan
19 sites
- Japan
-

- Manufacturing
sites - 111 sites
-
- Japan
46 sites - Outside Japan
65 sites
- Japan
- Manufacturing
(As of December 31, 2025)
Otsuka Holdings and consolidated companies
Fiscal 2025 consolidated revenue
¥ 2,468.9 billion
Fiscal 2025 business profit*
¥ 446.1 billion
Revenue by Business Segment
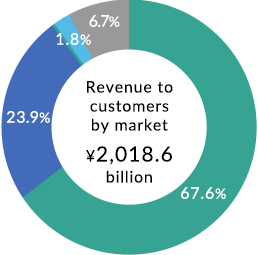
Pharmaceuticals
¥ 1,744.2 billion
Nutraceuticals
¥ 577.6 billion
Consumer Products
¥ 34.6 billion
Others
¥ 112.4 billion
Revenue by Geographical Segment
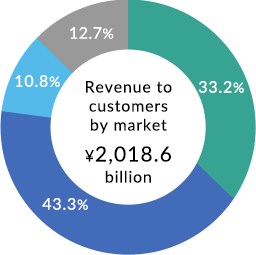
Japan
¥ 718.1 billion
North America
¥ 1,168.9 billion
Europe
¥ 284.9 billion
Others
¥ 297.0 billion
* Business profit = Revenue − Cost of sales − Selling, general and administrative expenses + Share of profit of associates − R&D expenses